Front Light NVIS Compatibility Study
Abstract
NVIS Compatibility—the ability of a device to not interfere with friendly NVIS devices, while also not revealing an operator’s position to the enemy—is a primary concern when designing light-emitting devices for military use. In order to determine that a device is compatible, spectral measurements must be made of all light that is emitted from a device. In this study, we take spectral measurements for a variety of Azumo light sources and materials and show that they are compatible with the U.S. Army’s Secure Lighting Objectives and that Azumo systems in a variety of forms can be recommended for devices which must be NVIS compatible.
Introduction
In order to ensure compatibility with certain night vision system requirements, several components of the U.S. Military have devised standards or recommendations for devices which emit visible and IR light. The goal of these is generally to compartmentalize systems emitting visible light from those emitting IR light to ensure both compatibility with friendly NVIS systems and to reduce the distance over which a device is detectable by enemy NVIS systems.
Here, we measure and present the emission spectra of several Azumo components and compare these results to a common NVIS compatibility recommendation (U.S. Army CECOM NVG Secure Lighting SOW). Compatibility with other NVIS standards (such as other elements of MIL-L-85762A or MIL-STD-3009) would require further testing to verify.
The Army Secure Lighting SOW (SLP), like some other NVIS compatibility standards, specifies a cutoff wavelength and a fraction of total emitted power which cannot lie at wavelengths above this cutoff. The SLP specifies a maximum cutoff wavelength of 700nm with not more than 0.5% of the device’s emitted power—over the range of 350nm to 930nm—lying at longer wavelengths. The SLP further advises that lower cutoff wavelengths are preferred, with a target cutoff closer to 600nm.
In the Azumo system, there are three potential sources of IR light. The first, and most obvious, is the LED itself, which supplies the input light to the display front light. If an Azumo device is supplied with light which itself does not comply with the SLP, it is unlikely (without additional input filtering) that the light reflected from the display will comply. In addition, material properties can come into play and change the relative emitted power spectrum from that inputted by the LED by the time the light exits the display. Material absorption can attenuate some wavelengths, while remaining transparent to others, resulting in a shift in the cutoff wavelength for a system. Finally, fluorescence can occur in a material-sequestering energy in some wavelengths and re-emitting it later at longer wavelengths—again resulting in a shift in the cutoff wavelength.
In the first phase of this NVIS feasibility study, the first source of IR light was investigated: spectra for two Azumo-recommended LEDs were measured in this feasibility study for potential use in a NVIS-compatible display front light. The cutoff wavelength for each LED was calculated and shown to be within the range specified by the SLP. The second phase of the feasibility study emphasized the impact of material on the spectral distribution reaching the display (through either absorption or fluorescence), measuring the spectra after transmission through three potential lightguide materials. Again, the cutoff was calculated and shown to comply with the SLP.

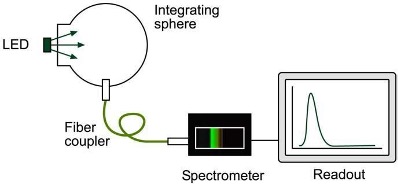
Figure 1: Typical LED spectrum measurement setup.

Figure 2: LED A emission spectrum and cumulative power over the 350mm to 930mm range.

Figure 3: LED B emission spectrum and cumulative power over the 350mm to 930mm range.
LED Emission Spectra
Two LEDs were selected based on their physical characteristics and their primary emission wavelength. LED A (Green Luxeon Z) has a top-fire configuration and a primary emission wavelength of 525 nm. LED B (Pure Green Bivar Standard) has a side-fire configuration and a primary emission wavelength of 532 nm.
In order to obtain an output spectrum, an LED was connected to a power supply and powered on a driving current typical for that LED. The light output of the LED was then coupled into the input fiber of a grating type spectrometer containing a CCD sensor (see Figure 1). The exposure time of the CCD sensor was then adjusted so that the peak of the emission spectrum was at roughly 75% of the sensor range. Several spectra were then recorded. These spectra were averaged together and background subtracted to yield a final spectrum for the LED. The output spectrum of LED A and LED B are shown below in Figures 2 and 3. Cumulative power plots are also given with insets showing the cutoff wavelength. LED A has a cutoff at approximately 585 nm, while LED B has a cutoff of approximately 618 nm.

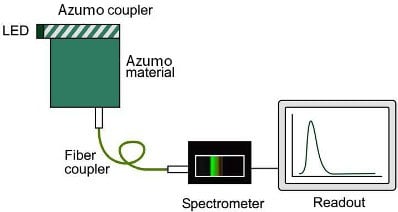
Figure 4: Typical material spectrum measurement setup using the Azumo coupler.
Material Effects
Materials have the ability to affect the spectral distribution by preferentially absorbing certain wavelengths or through fluorescence. The second phase of the feasibility study selected three proprietary Azumo material sets, named “A”, “B”, and “C” here, then measured the LED spectra transmitted through the materials.
Each LED and material combination was measured in a similar way as Phase 1. The LED was connected to a power supply and driven at a current typical for that LED, the output of the LED was coupled into the material under test using Azumo’s coupling methods, and the output of the Azumo system was coupled into the input fiber of the same spectrometer used for the LED measurements in Phase 1 (Figure 4). The exposure time of the spectrometer’s CCD was then adjusted until the peak of the observed spectrum was approximately 75% of the sensor range. Several such spectra were obtained for each combination of LED and material. These were then averaged and background subtracted to give the spectra presented below, Figures 5 and 6. In addition, the cumulative power is presented for each. Note that in these plots, the spectra are extremely similar for each of the materials and lay on top of each other. For all materials, LED A had a cutoff of approximately 588nm while LED B had a cutoff in the 585nm to 630nm range. This wider range for LED B is due to the greater uncertainty in the measurements of its relatively lower output when sent through Material B, a higher-loss material.
Analysis
The cumulative optical power shows that LED A has a cutoff wavelength of 585 nm and LED B has a cutoff wavelength of 618 nm. Each of the selected LEDs has a cutoff wavelength below the maximum allowed by the Army’s SLP. In addition, in combination with either of these LEDs, each of the selected Azumo LED and material combinations emits light with a spectrum with a cutoff wavelength below the maximum set by the SLP. Thus, a variety of Azumo systems can be designed which meet a common standard of NVIS compatibility. These systems can be designed to use either a top-fire LED or a side-fire LED, and can be composed of any of at least three materials.

Figure 5: LED A, materials A, B, and C emission spectrum and cumulative power over the 350nm to 930nm range.

Figure 6: LED B, materials A, B, and C emission spectrum and cumulative power over the 350nm to 930nm range.